Booth in front of the store lowers the storefront effectiveness
The tenant of the store in the shopping center asked us to investigate how the booth placed in front of the store affects the number of visits. We measured and compared the conversion rate from the storefront, i.e. what percentage of people walking down the corridor entered the store.
Purpose of the study
The unusual shape of the corridor in front of the client’s store required a detailed analysis. The storefront consists of two equal parts separated by the entrance to the store. In front of the right display there is an empty space and in front of the left part, in the middle of the gallery corridor, there is a so-called “booth” – another tenant’s point of sale, occupying about 30% of the corridor width. How do differences in the use of space in front of your storefront affect conversion? Is the effect noticeable to the store?
Measurement
Data was collected for 14 weeks, excluding holidays and days off, using Retailic Inteligence™ – a system for analyzing the activity of customers and sales personnel 1). Conversion was calculated from the four quadrants of the corridor: upper right (RA), upper left (LA), lower right (RB) and lower left (LB). The division results from the point of view of the camera placed in the store, so the “upper” quadrants were further away from the entrance, and the “lower” quadrants closer (Photo 1.) The conversion factor was calculated as a percentage of people appearing in a given quadrant from the left or right side of the corridor, which then entered the store.
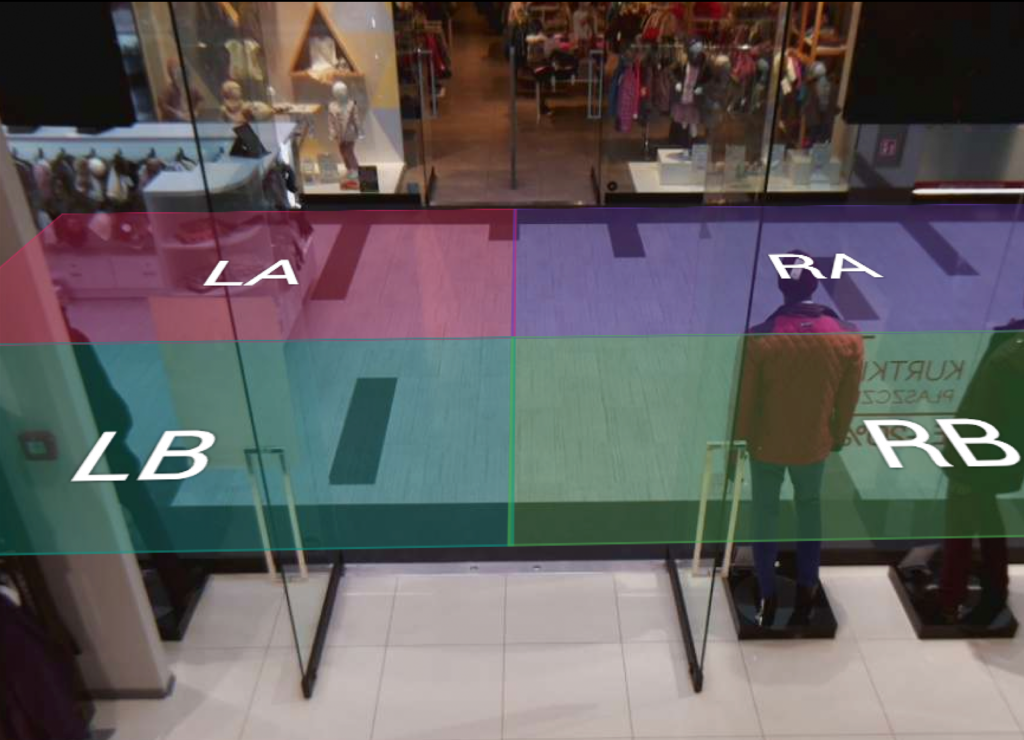
Photo 1. Division of the corridor into quadrants
Measurements
The overall conversion on the left and right sides was similar (1.5% on the left and 1.6% on the right). Conversion in the “upper” quadrants (further away from the store) amounted to 1.0% throughout the period. In the lower quadrants (closer to the store) it was 2.3%. Differences between the upper quadrants occurred, but were small: 1.2% for the left side (LA) and 0.9% for the right side (RA).
On the other hand, a significant difference appeared on the side closer to the store: in the lower left quadrant (LB) the conversion amounted to 1.7%, in the lower right (RB) – 3.5%.
Additional observations
- The exhibition is invisible for people moving by the display window until they are exactly opposite the glass due to being covered by a partition wall and reflections of light from skylights and lamps from the further part of the corridor (Photo 2).
- As soon as the site moves between the booth and the site, the offer of seasonal goods sold by the booth competes for the attention of a potential customer, and because the storefront display is invisible at close range for the reasons described in the previous paragraphs, people pay attention to the assortment displayed on the booth.
- If there are people watching the seasonal goods by the booth, people coming from the left side focus on avoiding them and avoiding collisions with people walking in the opposite direction.
- The limited scope of the storefront’s operation is shown in the photo below (Photo 2).
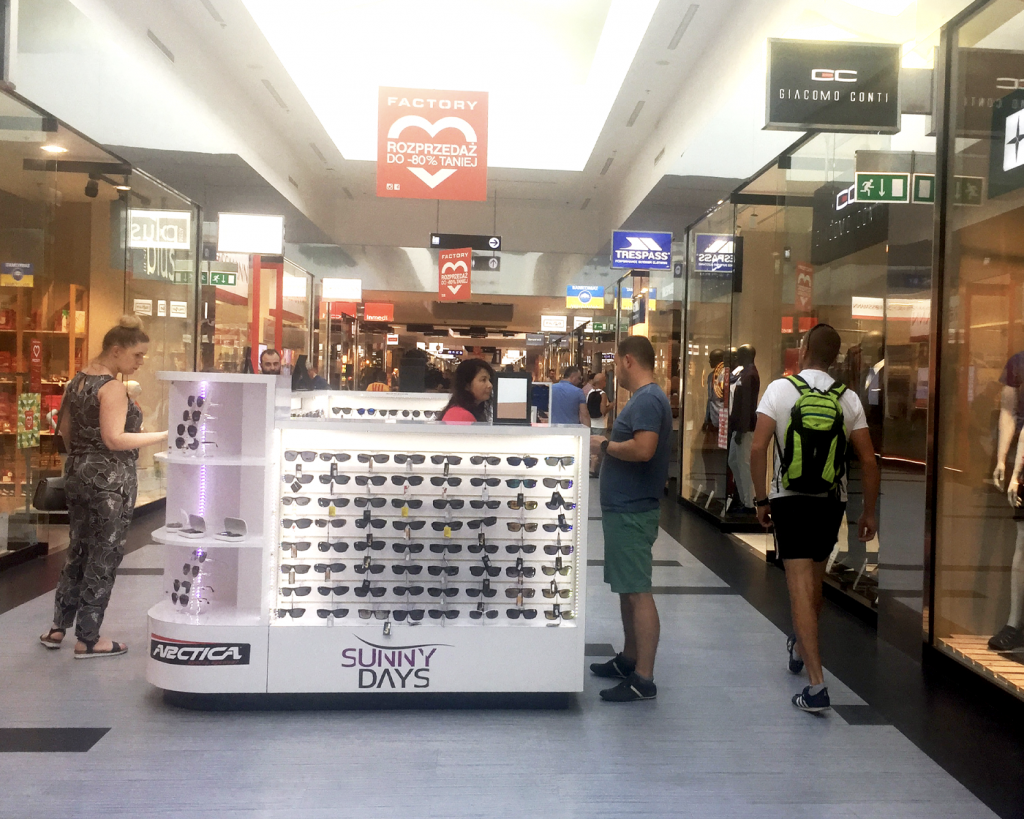
Photo 2. The booth and its customers model the path of people walking along the corridor, making it difficult to make eye contact with the storefront.
Conclusions
The big difference in conversion between the two lower (closer to the store) quadrants is surprising. Is the reason for the lower conversion of the lower left quadrant due to a booth?
The time during which the person coming from the left side has a chance to see the storefront exposure is about 2 seconds and is 60% shorter than the corresponding time for a storefront without a booth placed in front of it.
In addition, the attention of such a person is focused on avoiding the booth, people standing by it and people walking in the opposite direction. The distance from the glass is too small to properly familiarize yourself with the offer displayed on the storefront, and the attention is drawn to the seasonal assortment of booths, reducing the chances of noticing the shop window (Photo 2.)
A similar conversion between the upper quadrants allows to expect a similar relationship in the lower quadrants.
Thus, in the lower left quadrant, the conversion rate should be 3.5% of people walking down the corridor. A result of 1.7% means that a reduction in value can be estimated at around 50%. This is the equivalent of 1,800 visits per month that are not due to the booth. 2)
Recommendation
The “booth” placed in the middle of the corridor reduces the impact of the storefront and causes a decrease in the number of visits to the store and the conversion rate, and thus lower revenues. Removal of the booth is recommended. If this is not possible, the visibility of the storefront should be increased through posters and elements informing about the offer placed directly behind the glass.
Creating a space in front of the store that allows you to notice and familiarize yourself with the display of the storefront from a distance should increase its impact on people coming from the left side of the site, increase the number of visits and conversion rate, and increase sales.
_______________________________________________________________________
- Retailic Inteligence ™ allows you to conduct various measurements, test hypotheses, and compare multiple agents and models at once. As a result, it is possible to constantly optimize the efficiency of processes.
- In the analyzed period, the average value of revenue per visit was PLN 53.11. If it had remained the same after the booth was removed, an additional 1,800 visits per month could result in additional sales of up to 33% of the current turnover. In fact, this result will obviously be much lower.